
Canadian Spending Statistics 2026
Shelter, transportation and food take the biggest share of Canadian budgets. Here is how Canadians spend money, based on official data, and what it means for your own plan.
Get started free➜ Download the app➜
How do Canadians spend their money?
Canadian spending statistics from Statistics Canada show that households spend the largest share of their consumer budget on shelter, about 30%, followed by transportation and food at roughly 16% each. Household operations, recreation, health and personal care, clothing, and alcohol and tobacco make up the rest. Income taxes and pension contributions come on top of consumer spending.
Canadian spending statistics: the big picture
Canadian spending statistics come mainly from two Statistics Canada sources: the Survey of Household Spending, which asks households what they spend, and the Consumer Price Index basket, whose weights show the share of consumer spending that goes to each category. Both point the same way. Shelter is the biggest cost for Canadian households, and together shelter, transportation and food take about 60% of the consumer budget.
These are national averages across renters and owners, city and rural households, and every income level. Your own split may look quite different, especially if you rent in a large city or have no car.
Spending only makes sense next to income. See our guides to the average salary in Canada and average household income in Canada for the other side of the ledger.
How do Canadians spend their money by category?
Canadians spend their money mostly on necessities. Based on the Consumer Price Index basket weights published by Statistics Canada, shelter takes about three in every ten consumer dollars, and transportation and food each take about one in six. The ranges below reflect recent basket updates and are rounded.
| Category | Approximate share | What it includes |
|---|---|---|
| Shelter | 28% to 30% | Rent, mortgage interest, property tax, utilities, home insurance, maintenance |
| Transportation | 15% to 17% | Vehicle purchases, fuel, insurance, repairs, public transit, air travel |
| Food | 15% to 17% | Groceries and restaurant meals |
| Household operations and furnishings | about 14% | Phone, internet, child care, household supplies, furniture |
| Recreation, education and reading | 9% to 10% | Travel tours, sports, streaming, tuition, books |
| Health and personal care | about 5% | Health care goods and services, personal care products |
| Clothing and footwear | about 4% | Clothes, shoes, accessories |
| Alcohol, tobacco and cannabis | about 3% | Purchases from stores and restaurants |
Income taxes, CPP and EI contributions and savings are not part of these consumer spending weights. When Statistics Canada measures total household expenditure, income taxes are one of the largest items.
Which costs have grown fastest?
Shelter and food have been the costs Canadians feel most in recent years. Rent and mortgage interest costs rose sharply after 2022 as interest rates climbed and rental supply stayed tight. Grocery prices rose faster than overall inflation for much of 2022 and 2023, before easing.
The Consumer Price Index, published monthly by Statistics Canada, tracks these changes. The Bank of Canada targets 2% inflation, the midpoint of its 1% to 3% control range, and adjusts its policy interest rate to keep inflation near that target.
- Rent. See average rent in Canada for current ranges by city.
- Groceries. Our average grocery bill in Canada guide shows typical monthly food costs by household size.
- Utilities. See the average utility bill in Canada for electricity, heat and internet.
- Subscriptions. Small recurring charges add up; our look at subscription spending explains how to audit them.
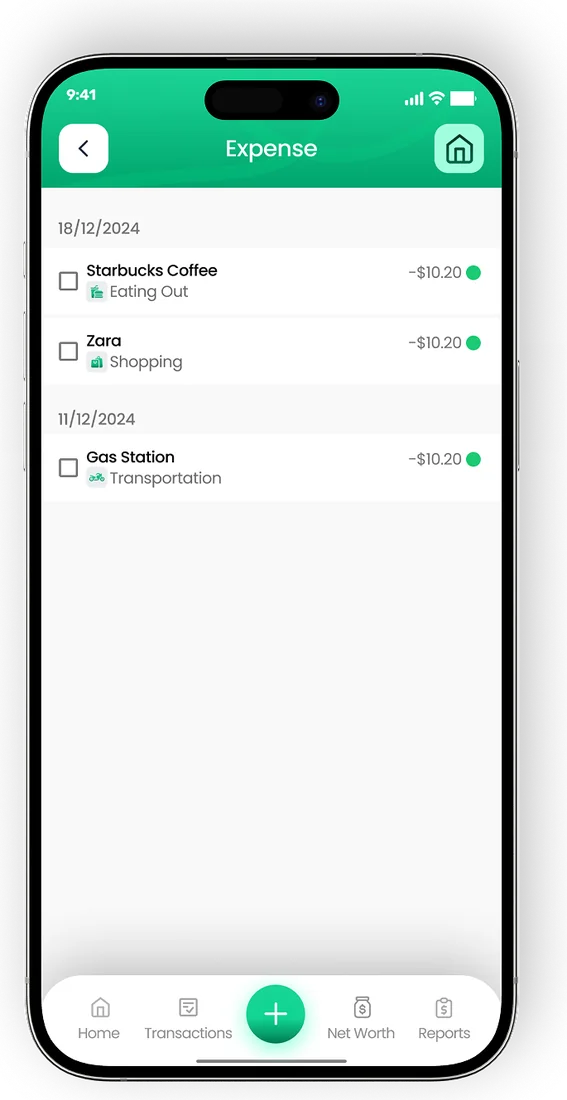
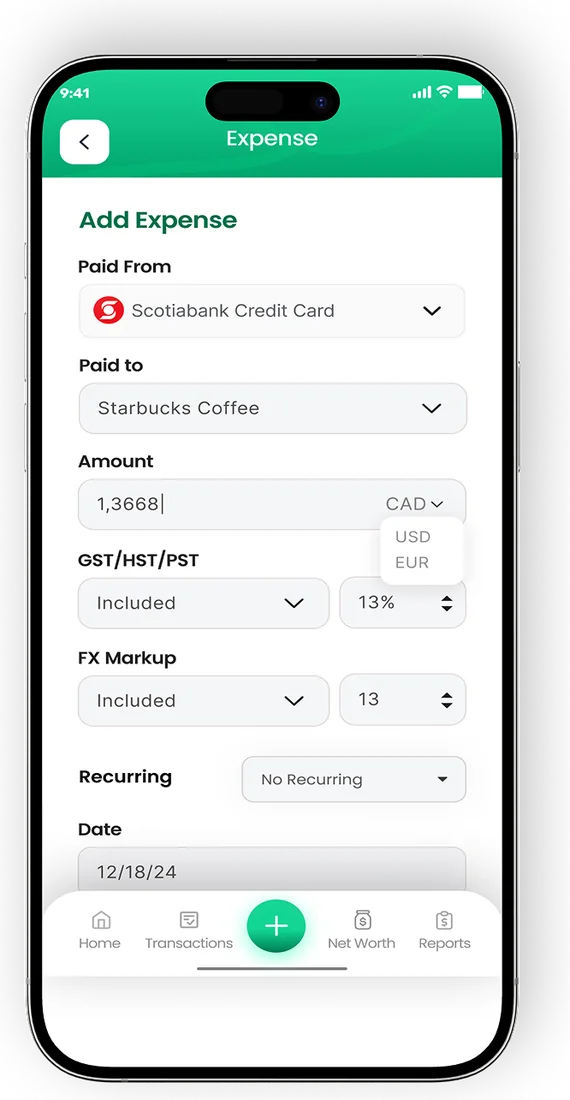
Log a purchase in two taps
- Smart categories sort every transaction
- Tag who spent what in a shared household
- Export PDF or Excel reports any month


How Canadians pay: cards, cash and credit
Most Canadian purchases are now paid by debit or credit card, often by tap. Bank of Canada research on methods of payment shows cash use has fallen steadily over the past decade, although many people still carry some cash and use it for small purchases.
Credit cards are popular because of rewards and purchase protection, but balances carried month to month are expensive. Paying in full each month avoids interest, and household debt in Canada shows the wider borrowing picture.
How to compare your spending with the national average
Compare your spending with the national average by calculating what share of your take-home pay goes to each category, then checking it against the table above. Shares are more useful than dollar amounts because they adjust for income.
- Track one full month. Record every purchase, including cash and small card payments.
- Group into the same categories. Shelter, transportation, food, household, recreation, health, clothing and other.
- Divide by your income. Work out each category as a percentage of take-home pay.
- Look for outliers. A category far above the national share is where changes will have the biggest effect.
- Set limits. Turn what you learn into monthly budgets for the categories that matter most.
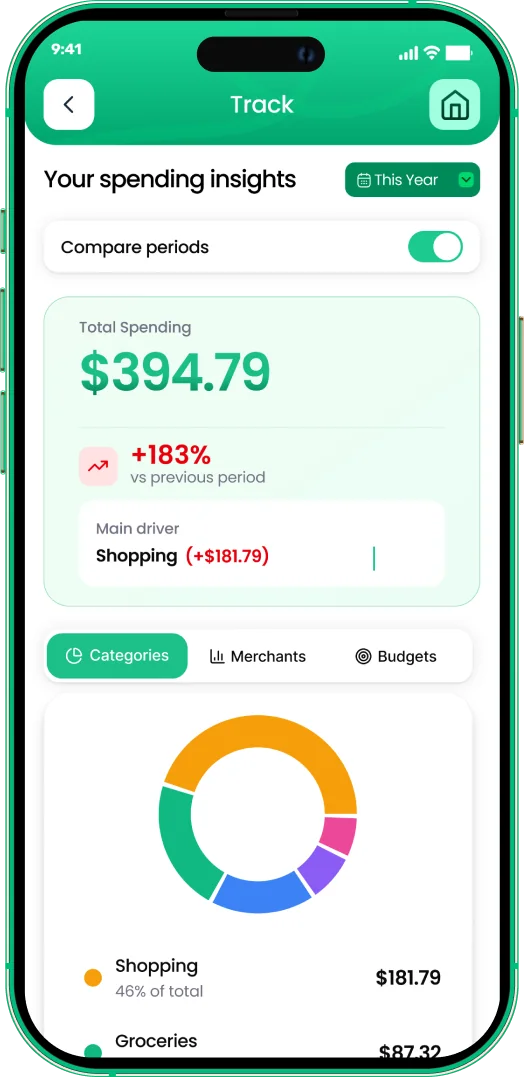
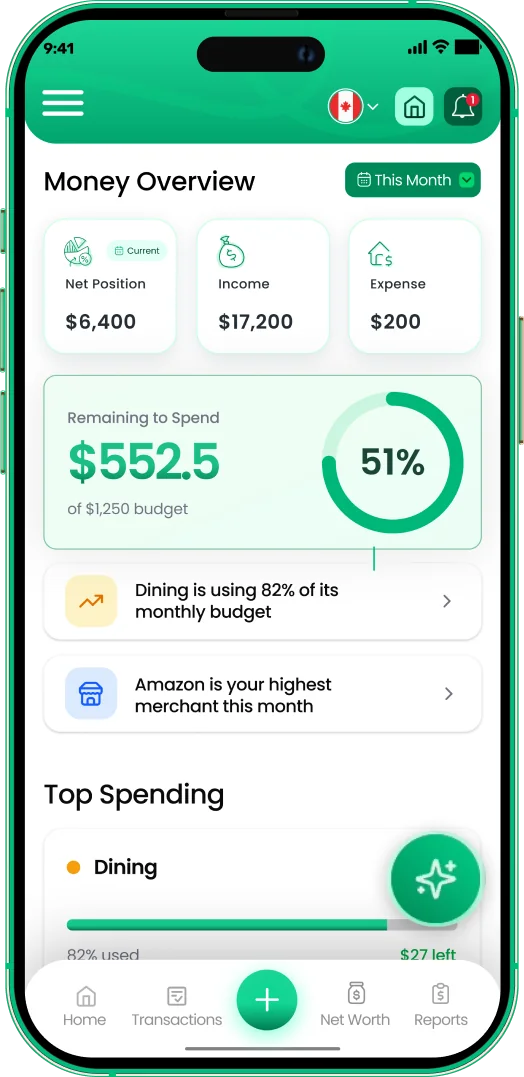
EMOH Pay does this automatically. It sorts transactions into categories, shows each as a share of spending in its reports, and sends a daily money digest so you notice changes early. It is free to start on iPhone, Android and the web. For more on how price increases affect a budget, read how inflation affects household budgeting.
Track every dollar

Put the numbers on autopilot
EMOH Pay tracks your spending, budgets and net worth on your phone and in the browser, always in sync. Free to start, made in Canada.
Get started free➜Canadian Spending Statistics 2026: frequently asked questions
What do Canadians spend the most money on?
Shelter. Rent or mortgage costs, property taxes, utilities and home insurance take about 30% of consumer spending on average, more than any other category, according to Statistics Canada data.
How much does the average Canadian household spend a year?
Statistics Canada's Survey of Household Spending publishes average annual spending by household, province and income group. Because figures change with each release, check the latest survey results on the Statistics Canada website for the current total.
How much do Canadians spend on food?
Food, including groceries and restaurants, takes roughly 15% to 17% of consumer spending. Groceries make up most of that. Actual amounts depend heavily on household size and how often you eat out.
Do Canadians still use cash?
Yes, but less than before. Bank of Canada research shows cash use has declined as tap-enabled debit and credit cards have grown. Many people still keep some cash for small purchases or emergencies.
What share of income should go to housing?
A common guideline is to keep housing below about 30% of gross income, which is also how CMHC defines affordable housing. In expensive cities many households spend more, which leaves less room for savings.
Sources and further reading
Related guides and tools
The average salary in Canada is about $1,347 a week in 2026, roughly $70,000 a year, per Statistics Canada. See pay by…
Average Household Income in CanadaAverage household income in Canada explained: median total and after-tax income from Statistics Canada, how it differs by…
Average Grocery Bill in CanadaThe average grocery bill in Canada by household size, from singles to families of five, why food prices rose, and practical…
Average Rent in Canada by City (2026)Average rent in Canada for 2026: typical one-bedroom ranges in 20 cities, why survey and asking rents differ, and how to…
Average Utility Bill in CanadaAverage utility bill in Canada: typical monthly costs for electricity, heat, water and internet, why bills differ by…
Average Subscription Spending (2026)How much do people spend on subscriptions? What the numbers can and cannot tell you, typical costs by type and a 15-minute…
Start free today
Free on iPhone, Android and the web. Upgrade to EMOH Pro anytime for bank sync and advanced AI.
Download for iOS➜ Get it on Android➜